

How to answer PTE Describe Image

Describe image is one of the questions in PTE Academics under speaking and writing and the name is self-explanatory. The question requires the test taker to describe the image displayed on the screen as precise as possible. The major communicative skill assessed is speaking.
The picture in most cases is a map, pie chart or bar chart. After the image is displayed on the screen, there is a 25 seconds countdown displayed in the status box allocated for the test taker to prepare the answer or response. When the 25 seconds countdown elapses, the microphone turns on and a soft voice comes on to give a signal to start recording. Speak immediately as soon as the microphone turns on. In addition, finish recording at least 3 seconds before the time elapses. The test taker has 40 seconds to provide the answer.
Tips on how to describe the image best

Provide the main points of the image

NB! Don’t forget to introduce the image.
Obviously, the picture represents something. What does it represent? What is distinctive about it? What makes it unique? These are the type of questions the response must answer. For example, if it is a map it is wise to explain the location represented on the map. There might also be legend which gives a description of the map its features; talk about that as well
If the image is a pie chart graph or bar chart, then highlight the highest and lowest point of on the graph and what they represent.
Know the different types of image popular for this question

In the preceding section, I only highlighted four images but PTE Academics is not limited to only four types. Other images include Venn diagrams, flow chart, line graph, tables, pictures, etc. Different type of graphs have different ways of description, therefore, the test taker has to be familiar with the language of communication used. For example, if it is a bar chart what is the statistical language or words used to describe bar charts?
Take notes in your notepad

Use the 25 seconds allocated for preparing your answer to note some important points in your notepad. Don’t write a long sentence because you will run out of time to cover all the points, just concentrate on key points that best describe the image.
Don’t wait any longer to prepare for the PTE exam – buy a PTE Voucher now and start studying today.
Speak clearly

Speak as if you are speaking to a human being. Don’t rush through your speech but speak with natural flowing speed. Moreover, once you have started recording, don’t restart a sentence before finishing the previous one even if you made a mistake or missed some point. Finish the sentence you have already started then start a new one. Don’t stammer and avoid using filler words also don’t pause for longer than 3 seconds since the microphone switches off if there is no recording taking place.
Be familiar with the scoring criteria

As it has been mentioned earlier describe image assesses speaking, in addition, it contributes towards oral fluency and pronunciation scores of the communicative skills. Moreover, the score range from 0-5 for all the skills tested in this question. The score is awarded based on disfluent, limited, intermediate, good, advance and native-like. It is important for the test taker to know the comprehensive scoring criteria followed for this question is graded.
How to give a response to a different type of images
Maps and pictures

These images in most cases have legends which give clear guidance or description to make sure the map or image makes sense. Provide the location and any other description represented by the legend. E.g. one of the map legends could match a colour on the map that represents countries experiencing droughts, flood or minimum rainfall in a certain period. Highlight these points in your answer.
Pie charts
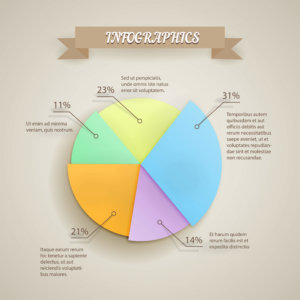
Pie charts represent a portion or percentage of something. Whatever it is that is represented by the pie chart must be mentioned. For example, you could introduce it like “The pie chart represents the percentages of car models imported in the USA in 2018.” Highlight the highest and the lowest portion and mention their numerical values. Use comparatives like “There is 5% of Bentley imported as compared to 25% Aston Martin.”
Graphs, Charts and tables
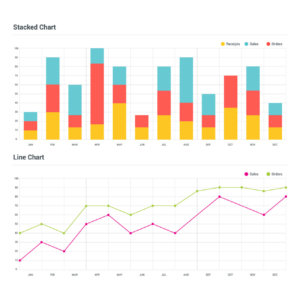
They represent data by highlighting the trends. There are low points, middle points and highpoints. Note the change of direction and mention it in your description. Use words or phrases such as increase, decrease, steady, etc. when providing a description.